| city | n | yes | no | na | assessable | pct_yes_assessable |
|---|---|---|---|---|---|---|
| Barcelona | 182 | 68 | 86 | 28 | 154 | 0.44 |
| Milan | 168 | 44 | 82 | 42 | 126 | 0.35 |
| Paris | 200 | 135 | 31 | 34 | 166 | 0.81 |
Manual validation of detected street-space transformations using Google Street View
We manually validated a sample of street-space transformations detected from OpenStreetMap (OSM) data in Barcelona, Milan, and Paris. The aim was to assess whether detected segments correspond to real changes in street space, using Google Street View (GSV) imagery.
Validation sample
Validation was conducted on a stratified sample of detected segments by transformation type and city.
For each city, segments were grouped into four categories:
pedestrianisation
living street
road diet
cycleway added
A target sample of approximately 50 segments per category was selected where possible. When the total number of detected segments was smaller, all available segments were included.
The final sample sizes were:
- Barcelona: pedestrianisation (32), living streets (50), road diets (50), cycleways (50)
- Milan: pedestrianisation (50), living streets (30), road diets (38), cycleways (50)
- Paris: pedestrianisation (50), living streets (50), road diets (50), cycleways (50)
This stratified design ensures comparable representation across transformation types but does not reflect their real-world frequency.
Validation procedure
Each sampled segment was manually inspected using GSV.
For each segment:
The location was accessed via a direct GSV link.
Imagery closest to the follow-up year was first identified.
This was compared with imagery closest to the baseline year.
Where necessary, earlier and later imagery was also inspected to determine whether changes occurred outside the period of interest.
Interactive maps were used as supplementary material to provide spatial context where needed.
Reference periods
Validation was conducted using the following baseline and follow-up years:
- Barcelona: ~2019 to ~2023
- Milan: ~2016 to ~2021
- Paris: ~2020 to ~2026
The objective was to assess whether a detectable change occurred within these periods, which were defined in relation to electoral cycles.
Validation criteria
Each segment was classified as:
yes— a change was clearly visible between the baseline and follow-up years
no— available evidence indicated that no such change occurred within the period, or that the detected change was incorrect
NA— the case could not be assessed confidently (e.g. insufficient or ambiguous imagery, or non-informative views such as interior imagery)
Comments were recorded to document ambiguous cases and situations where changes occurred outside the period of interest.
Spatial distribution of detected and validated segments
Interactive maps show the spatial distribution of detected segments by type and highlight the sampled segments used for validation.
Barcelona
Milan
Paris
Results
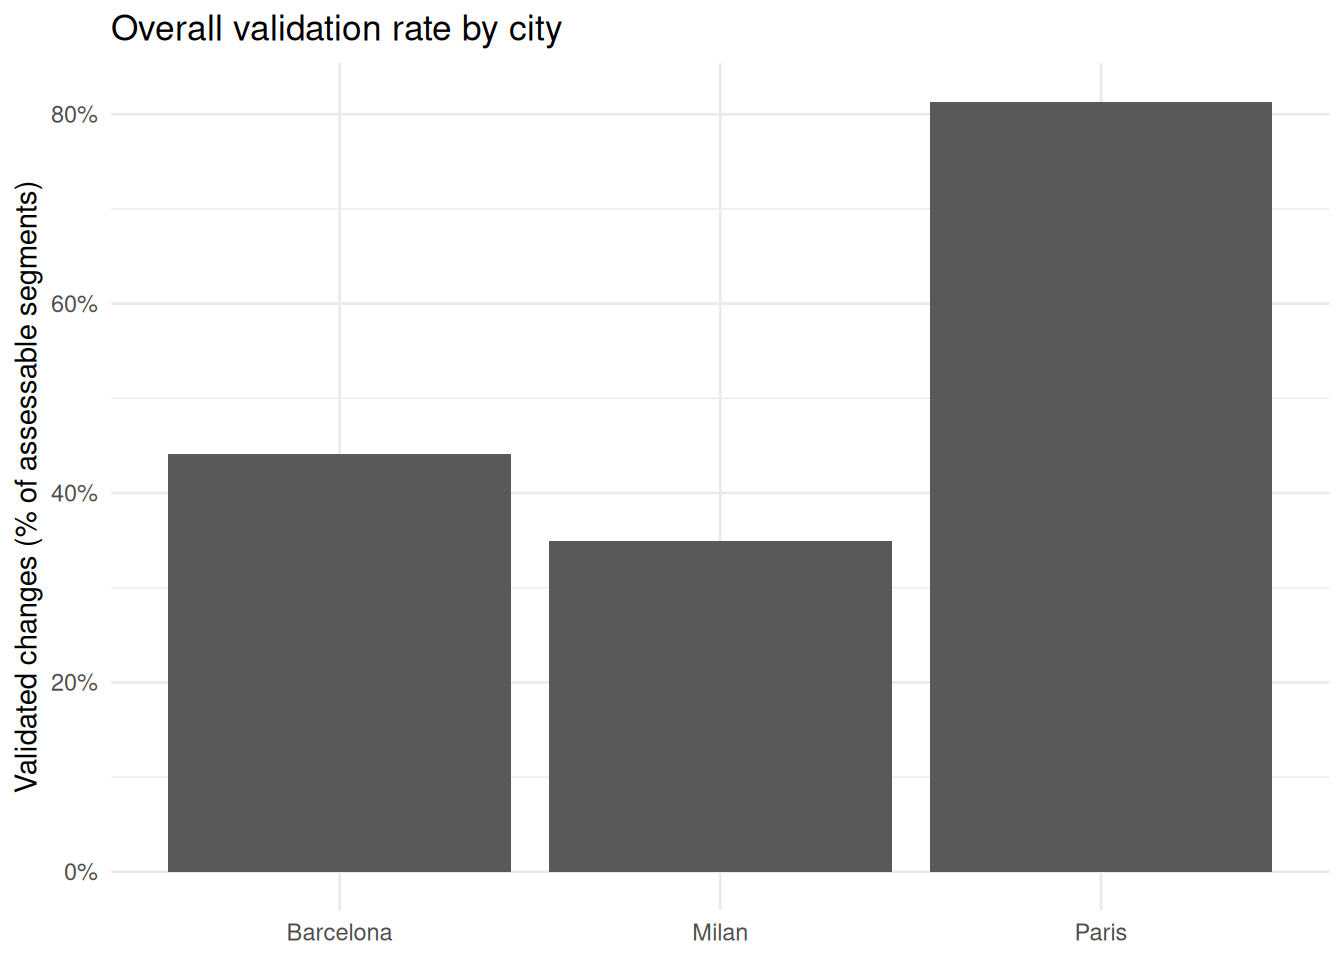
Overall validation rates
Across the three cities, validation rates varied substantially. Paris showed the highest agreement between detected OSM changes and manually validated street-space transformations, with 81% of assessable segments confirmed as valid changes, compared with 44% in Barcelona and 35% in Milan. The proportion of non-assessable cases was also notable, particularly in Milan, where 42 of 168 sampled segments could not be confidently assessed in GSV.
Comments from the validation indicate that a number of segments classified as invalid correspond to real changes occurring outside the period of interest, suggesting that part of the discrepancy reflects temporal misalignment rather than purely incorrect detections, particularly in Barcelona and Milan.
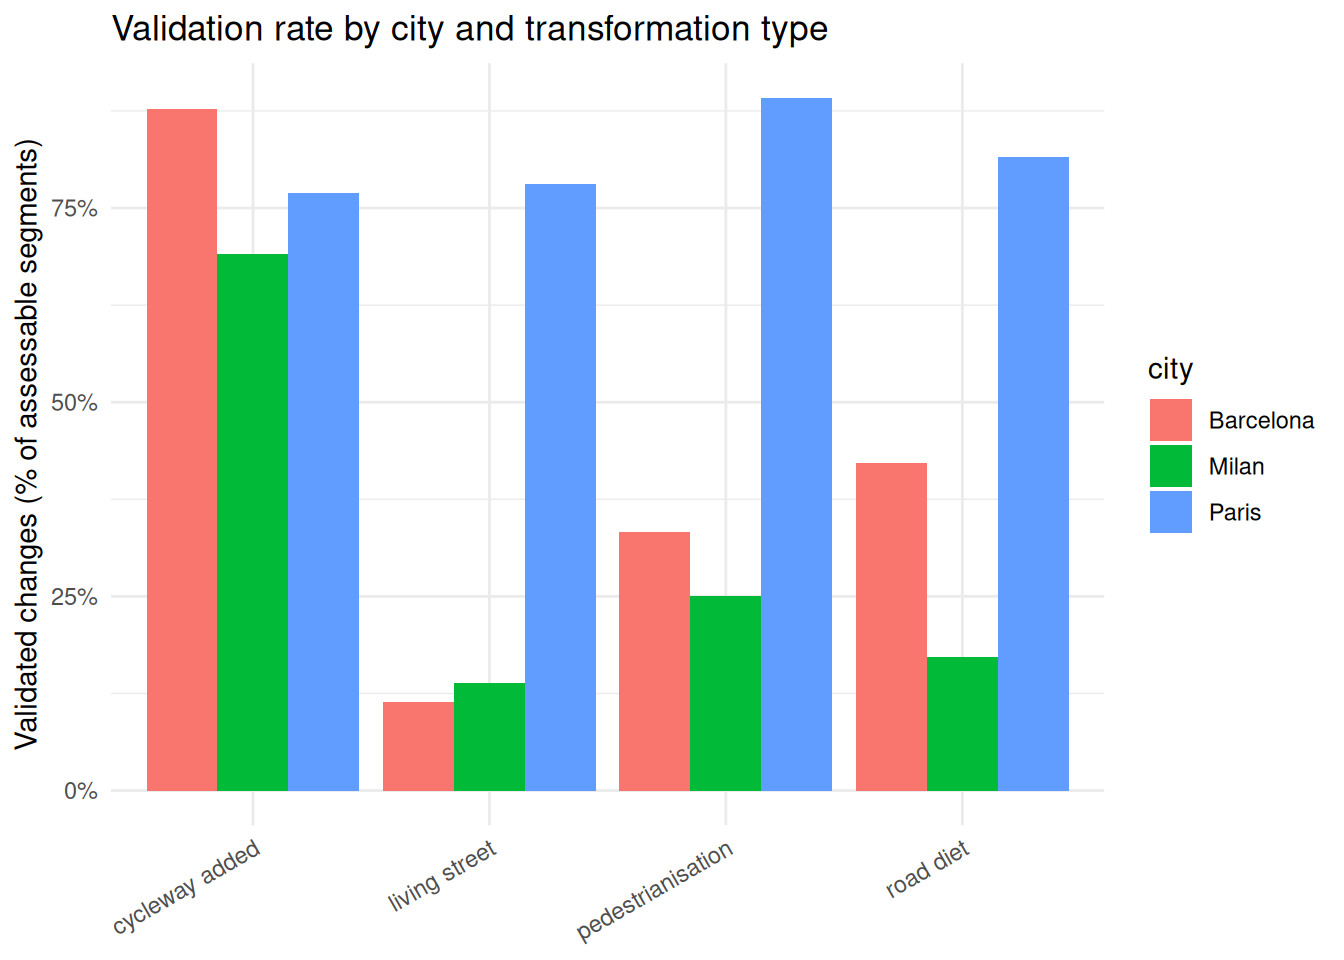
Validation rates by transformation type
Validation rates also differed markedly by transformation type. In Barcelona and Milan, cycleway additions were the most reliably detected category, with 88% and 69% of assessable segments confirmed, respectively. By contrast, living streets showed the lowest validation rates in both cities (11% and 14%).
Paris showed comparatively high validation rates across all four categories, particularly for pedestrianisation (89%) and road diets (82%).
| city | type | n | yes | no | na | assessable | pct_yes_assessable |
|---|---|---|---|---|---|---|---|
| Barcelona | cycleway added | 50 | 36 | 5 | 9 | 41 | 0.88 |
| Barcelona | living street | 50 | 5 | 39 | 6 | 44 | 0.11 |
| Barcelona | pedestrianisation | 32 | 8 | 16 | 8 | 24 | 0.33 |
| Barcelona | road diet | 50 | 19 | 26 | 5 | 45 | 0.42 |
| Milan | cycleway added | 50 | 29 | 13 | 8 | 42 | 0.69 |
| Milan | living street | 30 | 4 | 25 | 1 | 29 | 0.14 |
| Milan | pedestrianisation | 50 | 5 | 15 | 30 | 20 | 0.25 |
| Milan | road diet | 38 | 6 | 29 | 3 | 35 | 0.17 |
| Paris | cycleway added | 50 | 30 | 9 | 11 | 39 | 0.77 |
| Paris | living street | 50 | 32 | 9 | 9 | 41 | 0.78 |
| Paris | pedestrianisation | 50 | 33 | 4 | 13 | 37 | 0.89 |
| Paris | road diet | 50 | 40 | 9 | 1 | 49 | 0.82 |
Conclusions and next steps
The validation results indicate that OSM data quality varies substantially across cities and transformation types, making it unsuitable as the sole data source for some categories but sufficiently reliable for others to support a scalable cross-city index.
Primary indicator: use OSM-detected cycleway additions, given their consistently high validation rates across Barcelona (88%), Milan (69%), and Paris (77%).
Pedestrianisation: rely on official GIS data and planning documents. Data are already available for Milan, likely for Paris, and easily obtainable for Barcelona. Availability for the remaining cities will be assessed.
Excluded categories: living streets and road diets, given their low validation rates and conceptual ambiguity.
Next step: conduct a targeted OSM data quality check for the four unvalidated cities (Ljubljana, Warsaw, Utrecht, Malmö) before finalising inclusion.